Connected and Automated Vehicles
- Publication no: AP-R623-20
- ISBN: 978-1-922382-04-7
- Published: 25 June 2020
- PDF (free) Download
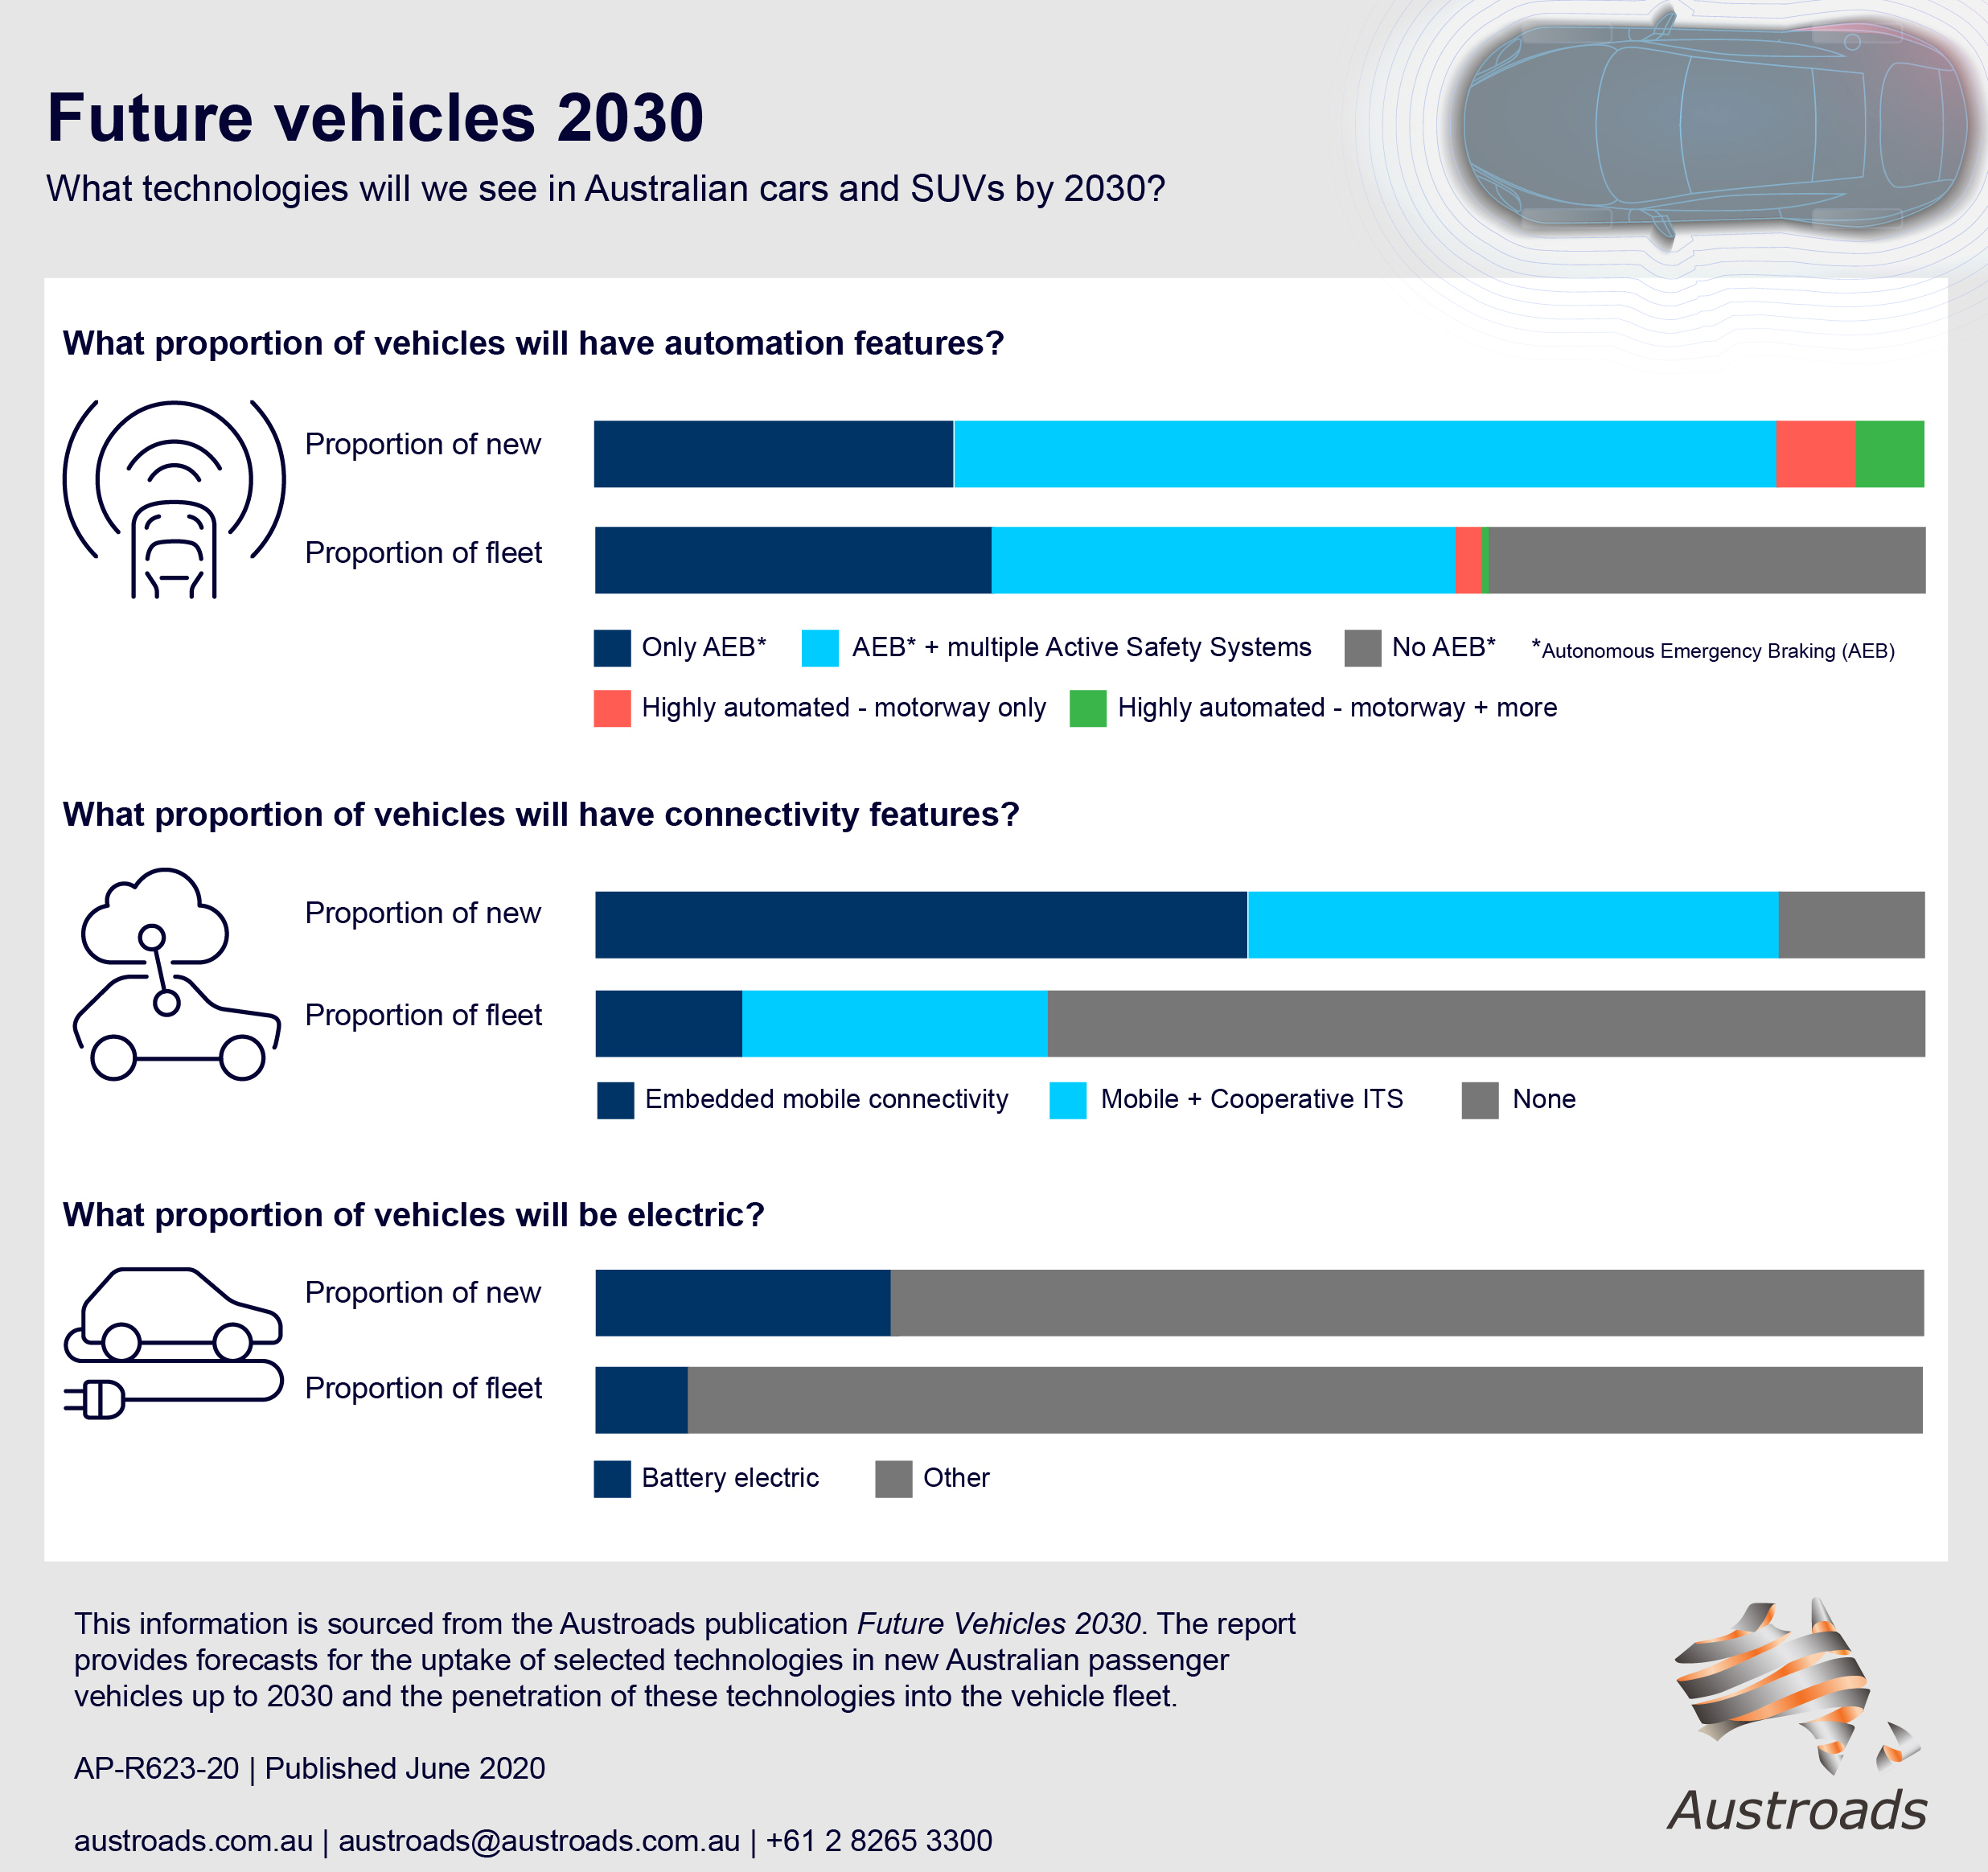
Australian and New Zealand vehicle fleets may be entering a period of significant change due to the emergence of Automated, Connected and Electric Vehicles and new models of vehicle ownership and use such as ride sharing services.
This report provides forecasts for the uptake of selected technologies in new Australian passenger vehicles up to 2030 and the penetration of these technologies into the vehicle fleet.
Discussions also cover how uptake and penetration may differ in New Zealand and for heavier vehicles, as well as for possible differences between urban and rural areas.
These forecasts are made available to assist future planning of Austroads Future Vehicles & Technology (FV&T) program, and will be useful for transport agency planners and others who assess the impacts of changes in the vehicle fleet for research purposes or to predict the direction of future transport and network operations.
- Summary
- 1. Background and Purpose
- 1.1 Interpreting and Using the Forecasts
- 1.1.1 The Forecasts are for Technology Penetration, not Technology Impacts
- 1.1.2 Forecasts are for Vehicles Equipped with a Technology from First Purchase
- 1.1.3 The Forecasts are for Sales Penetration and Fleet Penetration Not Share of Transport Task
- 1.1.4 Forecasts are not Indicators of Desired Policy Outcomes
- 1.1.5 The Forecasts Assume Continuation of Government Action
- 1.1.6 Forecasts are for Australian Passenger Vehicles
- 1.1.7 The Forecasts are Best Effort Forecasts
- 1.1.8 The Forecasts Cover Changes that have Significant Uncertainty
- 1.1 Interpreting and Using the Forecasts
- 2. Elements to be Forecast
- 2.1 Selection of Forecast Elements
- 3. Forecasting Approach
- 3.1 Estimating Technology Adoption
- 3.2 Fleet Penetration Model
- 3.3 Model Construction – No Embedded Technology
- 4. Forecasts
- 4.1 Vehicle Automation
- 4.2 Connectivity
- 4.3 Energy Source
- 4.4 Use for Passenger Transport
- 5. Differences from Base Forecasts
- 5.1 New Zealand Compared to Australia
- 5.2 Rural Regions Compared to Cities
- 5.3 Heavier Vehicles Compared to Passenger Vehicles
- 5.3.1 Differences between Cars, SUVs, Utilities and Vans
- 5.3.2 Differences for Heavy Vehicles
- 6. Potential Next Steps
- References
- Appendix A Estimating Technology Adoption
- Appendix B Fleet Penetration Model
- B.1 Data Sources
- B.2 Stepwise Explanation of Model Construction
- B.2.1 Step 1: Extract ABS Microdata
- B.2.2 Step 2: Determine Pattern of Exits From the Fleet (Attrition)
- B.2.3 Step 3: Cross-check Forecast Fleet Attrition Rates
- B.3 Step 4: Determine Pattern of Entries to the Fleet
- B.4 Step 5: Combine Forecast Additions and Attrition to Achieve Forecast Fleet
- B.5 Validity of Model Assumptions
- Appendix C Forecast for A1 Active Safety Systems
- C.1 About this Forecast Element
- C.2 Evidence Base
- C.2.1 Sales Penetration of Auto Emergency Braking (AEB)
- C.2.2 Sales Penetration of Adaptive and Standard Cruise Control
- C.2.3 Sales Penetration of Lane Keeping Assistance (LKA)
- C.2.4 Indications from the Adoption of Electronic Stability Control
- C.3 Forecast Sales Penetration for A1 Active Safety Systems
- C.4 Fleet Penetration Forecast for A1 Active Safety Systems
- C.5 AEB-only Compared to Multi-Function Active Safety Systems
- C.6 Interaction with Other Forecast Elements
- C.7 Validity of the Model Assumptions
- Appendix D Forecast for A2, A4, A5 Highly Automated Driving
- D.1 About these Forecast Elements
- D.2 Key Evidence Sources
- D.2.1 When Will Highly Automated Driving First Arrive in Australia?
- D.3 How Quickly Will Adoption Then Occur?
- D.3.1 Validating the Forecast Fleet Penetration Rates
- D.4 Forecast Sales Penetration for Highly Automated Driving
- D.4.1 A2 Highly Automated Driving for Motorways
- D.4.2 A4 Highly Automated Driving for Many Urban Journeys and Motorways
- D.4.3 A5 Highly Automated Driving for Many Rural Journeys
- D.5 Fleet Penetration Forecast for Highly Automated Driving
- D.5.1 A2 Highly Automated Driving for Motorways
- D.5.2 A4 Highly Automated Driving for Many Urban Journeys and Motorways
- D.5.3 A5 Highly Automated Driving for many rural journeys
- D.6 Comparison to Other Forecasts
- D.7 What Would Need to be Different to Increase the Forecast?
- D.7.1 Bring Forward the First Available Date for Technology
- D.7.2 Accelerate the Rate of Sales Penetration Increase
- D.7.3 Leapfrog the Innovation Phase
- D.7.4 Accelerate the Rate of Turnover of the Vehicle fleet, by Increasing Both New Vehicle Sales and Exits from the Fleet
- D.8 Interaction Between the Forecast Elements
- D.9 Interaction with Other Forecast Elements
- D.10 Validity of the Model Assumptions
- Appendix E Forecast for C1 Cooperative ITS
- E.1 About this Forecast Element
- E.2 Evidence Base
- E.2.1 Analyses of C-ITS Uptake
- E.2.2 Recent Announcements
- E.2.3 Implications for the Forecasts
- E.3 Forecast Sales Penetration for C1 Cooperative ITS
- E.4 Fleet Penetration Forecast for C1 Cooperative ITS
- E.5 Interaction with Other Forecast Elements
- E.6 Validity of the Model Assumptions
- Appendix F Forecast for C2 Cloud Connectivity
- F.1 About this Forecast Element
- F.2 Evidence Base
- F.3 Forecast Sales Penetration for C2 Cloud Connectivity
- F.4 Fleet Penetration Forecast for C2 Cloud Connectivity
- F.5 Interaction with Other Forecast Elements
- F.6 Validity of the Model Assumptions
- Appendix G Forecast for E1 Electric Vehicles
- G.1 About this Forecast Element
- G.2 Evidence Base
- G.3 Forecast Sales Penetration for E1 Electric Vehicles
- G.4 Fleet Penetration Forecast for E1 Electric Vehicles
- G.5 Interaction with Other Forecast Elements
- G.6 Validity of the Model Assumptions
- G.7 Discussion of Hydrogen Fuelled Electric Power
- Appendix H Forecast for S2 Vehicles Used as For Hire with Driver
- H.1 About this Forecast Element
- H.2 Evidence Base
- H.2.1 Australian and New Zealand Vehicle Registration Data
- H.2.2 Australian and New Zealand Ride Share Impact Data
- H.2.3 International Data
- H.3 Forecast Model for this Element
- H.4 Fleet Penetration Forecast for S2 For Hire with Driver
- H.5 Interaction with Other Forecast Elements
- H.6 Validity of the Model Assumptions
- Appendix I Discussion of Differences between New Zealand and Australia
- I.1 Imported Used Vehicles Play a Significant Role in New Zealand
- I.2 Implications for Vehicle Technology Adoption in New Zealand Compared to the Forecasts for Australia
- Appendix J Discussion of Differences between Vehicle Types
- J.1 Differences between Cars, SUVs, Utilities and Vans
- J.2 Differences to Other Vehicle Types